
Where Liquid Staking Yield Leaks
What the Protocol Emits vs. What You Actually Earn
Gross yield is easy. Net yield computation integrity is the work.
Most often in crypto, APR is a protocol emission rate, not an accurate reflection of net return.
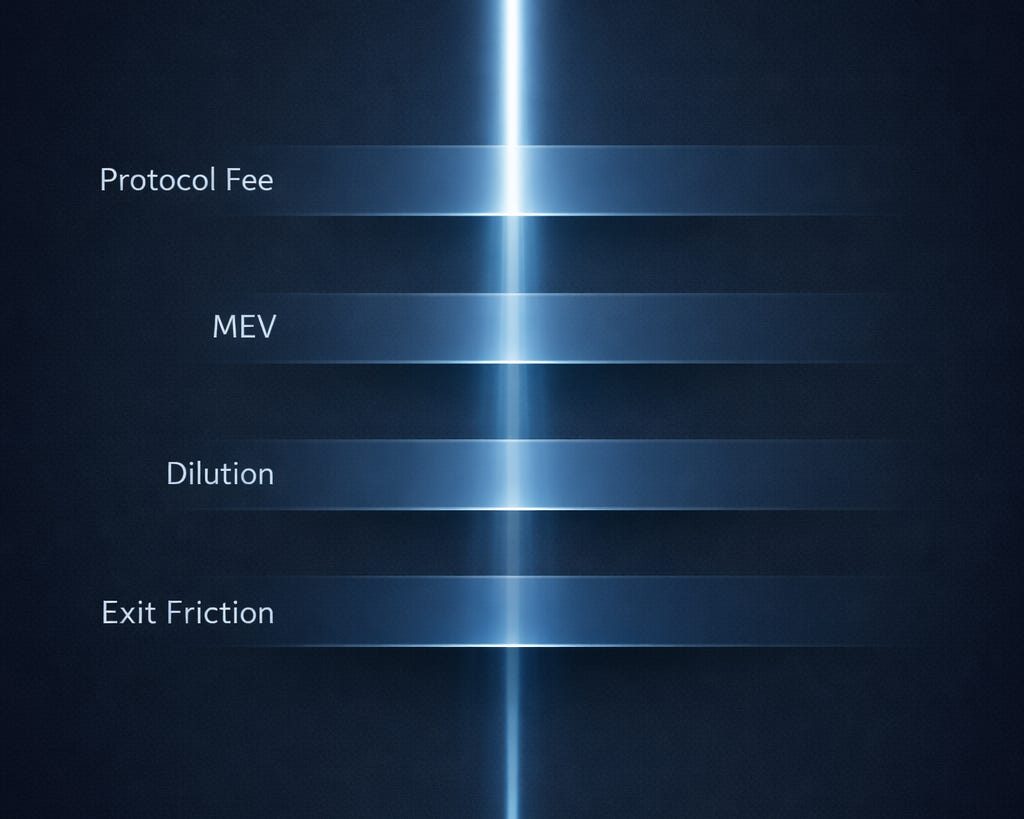
Staking analysis tends to stop at a headline APR (due diligence done… yeah, not so much). That number is the starting point. Between it and what actually arrives in your wallet sit a series of structural leakages: fees, MEV dynamics, liquidity conditions, exit timing, and dilution effects. Each is measurable. None of them are disclosed on the same dashboard page as the APR.
And liquid staking doesn’t remove friction. It relocates it.
If you’ve never computed your realized yield through exit, you haven’t measured the product. This post names the leaks and builds a framework for measuring them.
What you should measure: Net Economic Yield
There’s a number that matters. It’s never advertised. By anybody. You have to build it yourself.
Call it Net Economic Yield (NEY). It’s the return that survives the full round trip from entry to exit.
The construction looks like this:
Net Economic Yield = Gross validator reward rate
protocol and operator fees +/- MEV capture share (infrastructure-dependent and regime-sensitive)
dilution adjustment (what portion of yield is simply inflation compensation)
slippage or discount on entry and exit
time-to-liquidity drag (queues, epoch delays)
integration leakage (position design, accounting drift)
Ordering matters: account for validator-layer frictions first, macro dilution next, and exit frictions last.
Baseline: “APR” is not one thing
Before naming the leaks, I’ll establish what the underlying product actually is, because ETH and SOL staking are structurally different.
Ethereum validator rewards are a blend of two distinct sources: consensus layer issuance (protocol-determined, stable, based on total active stake and validator duties) and execution layer income (priority fees plus MEV, paid by users, highly variable). In early 2026, aggregate validator APY is being cited at roughly 3.5 to 4.2% annualized. The consensus layer often contributes ~2–3% in this regime; the execution layer component, fees and MEV, accounts for the remainder.
Execution-layer rewards are market-dependent. They are paid by users, not minted by protocol schedule. That distinction matters. Consensus rewards are deterministic. Execution rewards are not.
Solana staking yield is more dominated by scheduled inflation. The protocol started at 8% annual inflation, reduces that rate by 15% per year toward a long-term floor of 1.5%, and directs the vast majority of inflationary issuance to staked accounts and validators, net of commission and performance variance. As of early 2026, inflation fluctuates between 4-to-6%. Staking APY figures in the 6-to-7% range are consistent with that inflation rate, adjusted for staking participation, validator uptime, and commission.
If you don’t separate issuance yield from fee and MEV yield, you’re not doing yield analysis. You’re reading marketing copy.
Leak #1: Fees are a permanent skim on rewards
Every liquid staking protocol takes a cut. The structure varies; the result does not. The protocol skims a portion of what the underlying validators earn before any of it reaches you.
You are not just staking. You are entering a revenue-sharing agreement.
Lido charges 10% of staking rewards, split between node operators and the Lido DAO treasury. Rocket Pool charges variable commission at the minipool level, with the protocol taking a portion as well. Marinade charges a fee on rewards and on delayed unstaking. The specific numbers matter less than the structural fact: the protocol and its operators are rent-takers on your reward stream.
Two things make this more significant than it appears.
First, it compounds: a 10% skim is applied to every reward period, forever. The cost accumulates.
Second, fee policy is governed, not fixed. Any change made by a protocol results from a governance decision and can be changed again by another governance decision. This is not hypothetical. Multiple major liquid stacking token (LST) protocols have active or recently resolved governance proposals altering fee structures. The yield integrity of a staking position is only as stable as the governance environment it operates in.
This is why Moondance tracks fee-policy drift and incentive regime changes as yield events.
Leak #2: MEV is either yield uplift or yield siphon, depending on structure
MEV (maximal extractable value) has become a meaningful component of staking returns. It is also the most structurally opaque component.
On Ethereum, validators using MEV-Boost outsource block construction to specialized builders. Builders compete for inclusion by bidding a portion of the MEV they extract. Research suggests validators capture a majority of extracted MEV through this system. For Lido validators, MEV that reaches the validator is routed into Lido’s Execution Rewards Vault and then included in the rebasing mechanism that distributes rewards to stETH holders after protocol and node operator fees.
For Rocket Pool, MEV earned by participating validators enters a Smoothing Pool and is distributed to rETH stakers and node operators at checkpoint intervals. Neither protocol publishes a specific percentage of MEV that ultimately arrives at the holder level versus being retained by operators and DAOs.
On Solana, the numbers are more concrete. Jito infrastructure, a modified validator client and an off-chain block engine that runs auctions where MEV searchers bid for transaction inclusion, has been widely adopted. One institutional validator operator reported that Jito MEV infrastructure contributed 13 to 15%1 of total staking rewards in Q2 2025. Several analyses suggest MEV accounts for roughly 14% of total staking returns on average, with peaks of 20 to 30% during high-activity periods. Approximately 92% of stake weight on Solana runs on MEV-enabled clients as of early 2025, meaning MEV capture is nearly universal across the validator set.
MEV-funded yield is paid for by other network participants (i.e., it’s not free money). It’s redistributed edge: value extracted from traders and DeFi users, redirected to validators and delegators. The staker who benefits from MEV-boosted APY is, in an accounting sense, receiving a transfer from someone else’s transaction.
This doesn’t make MEV yield inferior. It makes it structurally different. And it makes the infrastructure that captures and distributes it a first-class variable. The yield is only as durable as the auction mechanism that routes it.
Moondance treats MEV policy and capture infrastructure as primary yield variables. When that infrastructure changes, the yield changes.
Leak #3: “Liquid” is a conditional claim
The liquidity in “liquid staking” is real. It is not guaranteed at par. A 1% exit discount can easily erase multiple months of staking yield.
LSTs trade on secondary markets at prices that are close to, but not always equal to the underlying staked asset. Over the past 18 months, major LSTs have generally traded near parity: stETH/ETH has ranged tightly around 0.995 to 1.002, rETH tends to trade at a small persistent premium of roughly 1 to 2% (reflecting supply constraints), and mSOL has shown deviations under 2% during SOL volatility. Under normal conditions, the peg holds.
One relevant question is: what happens when conditions are not normal?
The historical record is instructive. stETH traded at discounts of up to 6%2 during the 2022 stress period driven by leveraged unwinds and Curve pool imbalances. That discount was not a protocol failure. The 1:1 backing was intact. It was a secondary market failure driven by liquidity dynamics, the same dynamics that can recur in any stress environment where more holders want to exit than the available market depth can absorb.
Exit queues are another observable dimension. Ethereum’s native validator exit queue extended to approximately 38 days during a November 2025 stress window. Marinade’s delayed unstake on Solana runs 2 to 4 days, spanning 1 to 2 epochs. These durations are not emergencies. They are structural features that can become costs when the exit decision is time-sensitive.
During normal conditions, the discount and the queue are not noticeable. During stress, which is exactly when you are most likely to want to exit, both expand. The liquidity is real. It is also priced to protect the protocol, not the holder. Under stress, liquidity prioritizes system stability over individual profits.
Leak #4: Plain old yield dilution
This is the most uncomfortable point in the analysis and the one most staking commentary avoids entirely.
Staking rewards are denominated in the asset you’re staking. If the supply of that asset is expanding, a portion of what you call “yield” is not income. It is dilution offset. You are earning tokens to keep pace with issuance, not to build real buying power.
A 6% staking yield in a 5% inflation regime is not a 6% economic return.
On Solana, the inflation schedule is explicit and documented (see Solana Foundation documentation on inflation schedule and epoch issuance3). Inflation in 2026 sits in the mid-single-digit range, between 4-to-6% depending on measurement window. Staking APY in the 6-to-7% range implies a thin in-token margin, before fees, MEV variability, and commission are considered.
Several analyses frame Solana’s real staking yield in 2026 as 0 to 3% after accounting for this inflation. Validators are producing those numbers. After their commission comes out, the delegator receives less.
On Ethereum, the picture is regime-dependent. EIP-1559 introduced a fee-burning mechanism that makes the ETH supply dynamic: in high-activity periods, the supply can be deflationary; in low-activity periods, it can be modestly inflationary. Staking commentary often references whichever regime supports the preferred narrative. The honest answer is that you have to check the current supply dynamic, not repeat a slogan.
In some regimes, staking is insurance against dilution, not income.
If you ignore the dilution context, you misunderstand rate. This is among the many reasons why Moondance treats yield in net economic terms rather than trusting headline APR.
A worked example: what the math actually looks like
Take a hypothetical ETH staking position through an LST.
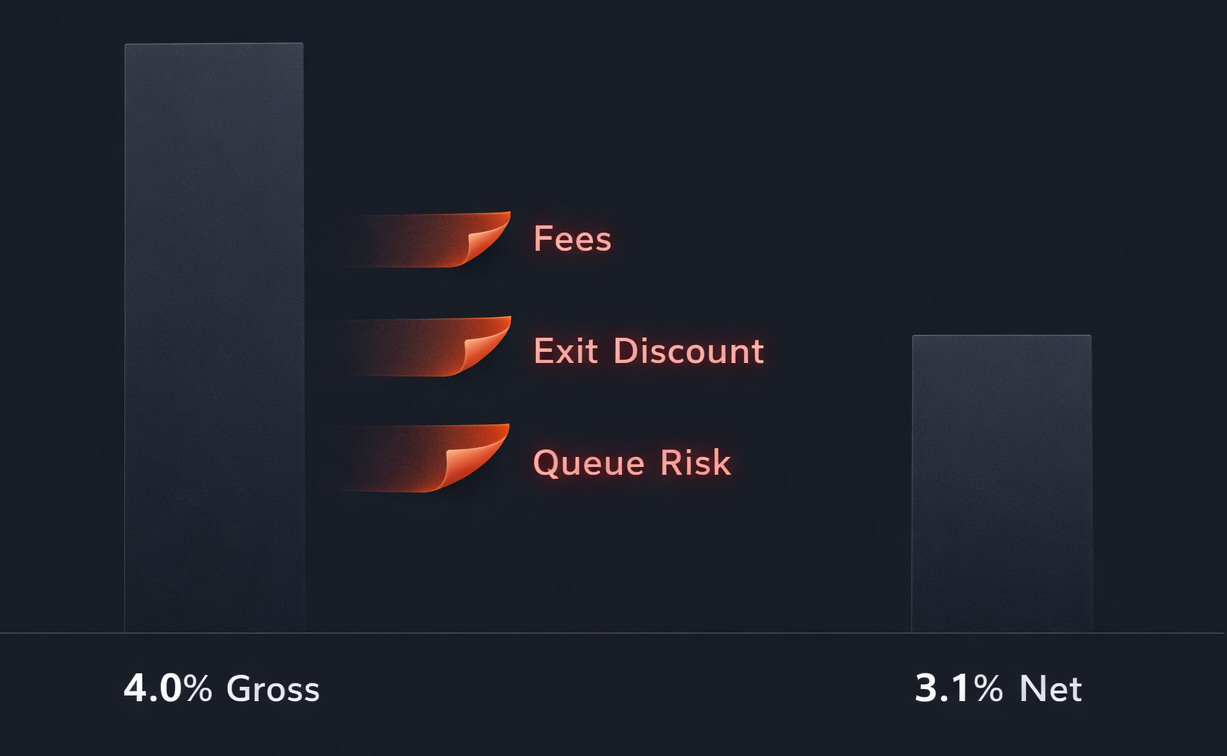
Gross validator rate, inclusive of average MEV capture: 4.0% annualized.
Assume a protocol plus operator fee of 10% of rewards. That’s a 0.4% drag. Post-fee rate: 3.6%.
Apply an exit discount. Assume a secondary market exit at 0.5% below the underlying, which is well within the historical normal range and well below stress-period discounts. Over a 12-month holding period, that’s a 50 basis point drag on realized return.
0.5% isn’t much, right? Wrong. That 0.5% exit discount erased roughly two months of supposedly lucrative yield.
Realized Net Economic Yield: approximately 3.1%. Assuming no further possible leaks (e.g. liquidity crunch or exit queue delay).
4.0% – 0.4% fee – 0.5% exit discount ≈ 3.1%
This is not a scandal. It’s math. The gap between 4.0% and 3.1% represents fees, exit friction, and structural realities that the headline number obscures. The point is not that 3.1% is a bad outcome. The point is that you should compute it before sizing the position. Don’t let it catch you off guard after the fact.
(Also note: this is not a one-and-done calculation. The variables move.)
The Questions You Should Be Asking:
What is my expected Net Economic Yield under normal conditions?
What about under stress?
How does this affect my plans?
What Moondance tracks
My monitoring thesis is simple: gross yield is stable and easy to observe. Net yield integrity requires ongoing attention because the variables between gross and net are not static.
Moondance tracks these as first-class yield determinants:
Fee policy drift: protocol and operator fee changes via governance
MEV capture and distribution regime: client infrastructure, auction structure, staker share
Liquidity depth and discount behavior: secondary market conditions, pool depth, stress-period signals
Exit friction: native validator queues, LST redemption mechanics, epoch timing
Dilution regime shifts: supply dynamics for ETH and SOL relative to stated staking yield
Gross yield is easy. Net yield integrity is the work. If you don’t monitor leaks, you work blind against the wrong number.
Thank you for reading.
Unclear on something? Want a topic covered? Submit Your Questions Here
I read everything. Good questions may become future posts.
If this analysis was useful, Moondance Research goes deeper.
I publish one paid piece each week focused on structural risk, capital protection, and honest yield literacy.
Paid subscribers receive the full archive, reference-grade frameworks, and downloadable artifacts designed to spot opportunities and reduce the probability of getting financially wrecked.
Founding 100 subscribers receive permanent preferred pricing as recognition for supporting Moondance in its earliest phase.
→ You can learn more or subscribe here.
Figment: Solana Validator Performance & Jito MEV Contribution (Q2 2025)
https://figment.io/insights/solana-staking-and-mev/
Curve stETH/ETH pool imbalance data (June 2022 stress window)
https://dune.com/queries/steth-discount-history
https://curve.fi/#/ethereum/pools/steth
Solana Foundation: Inflation Schedule
https://docs.solana.com/inflation